

It’s an election year,
and everyone’s arguing.
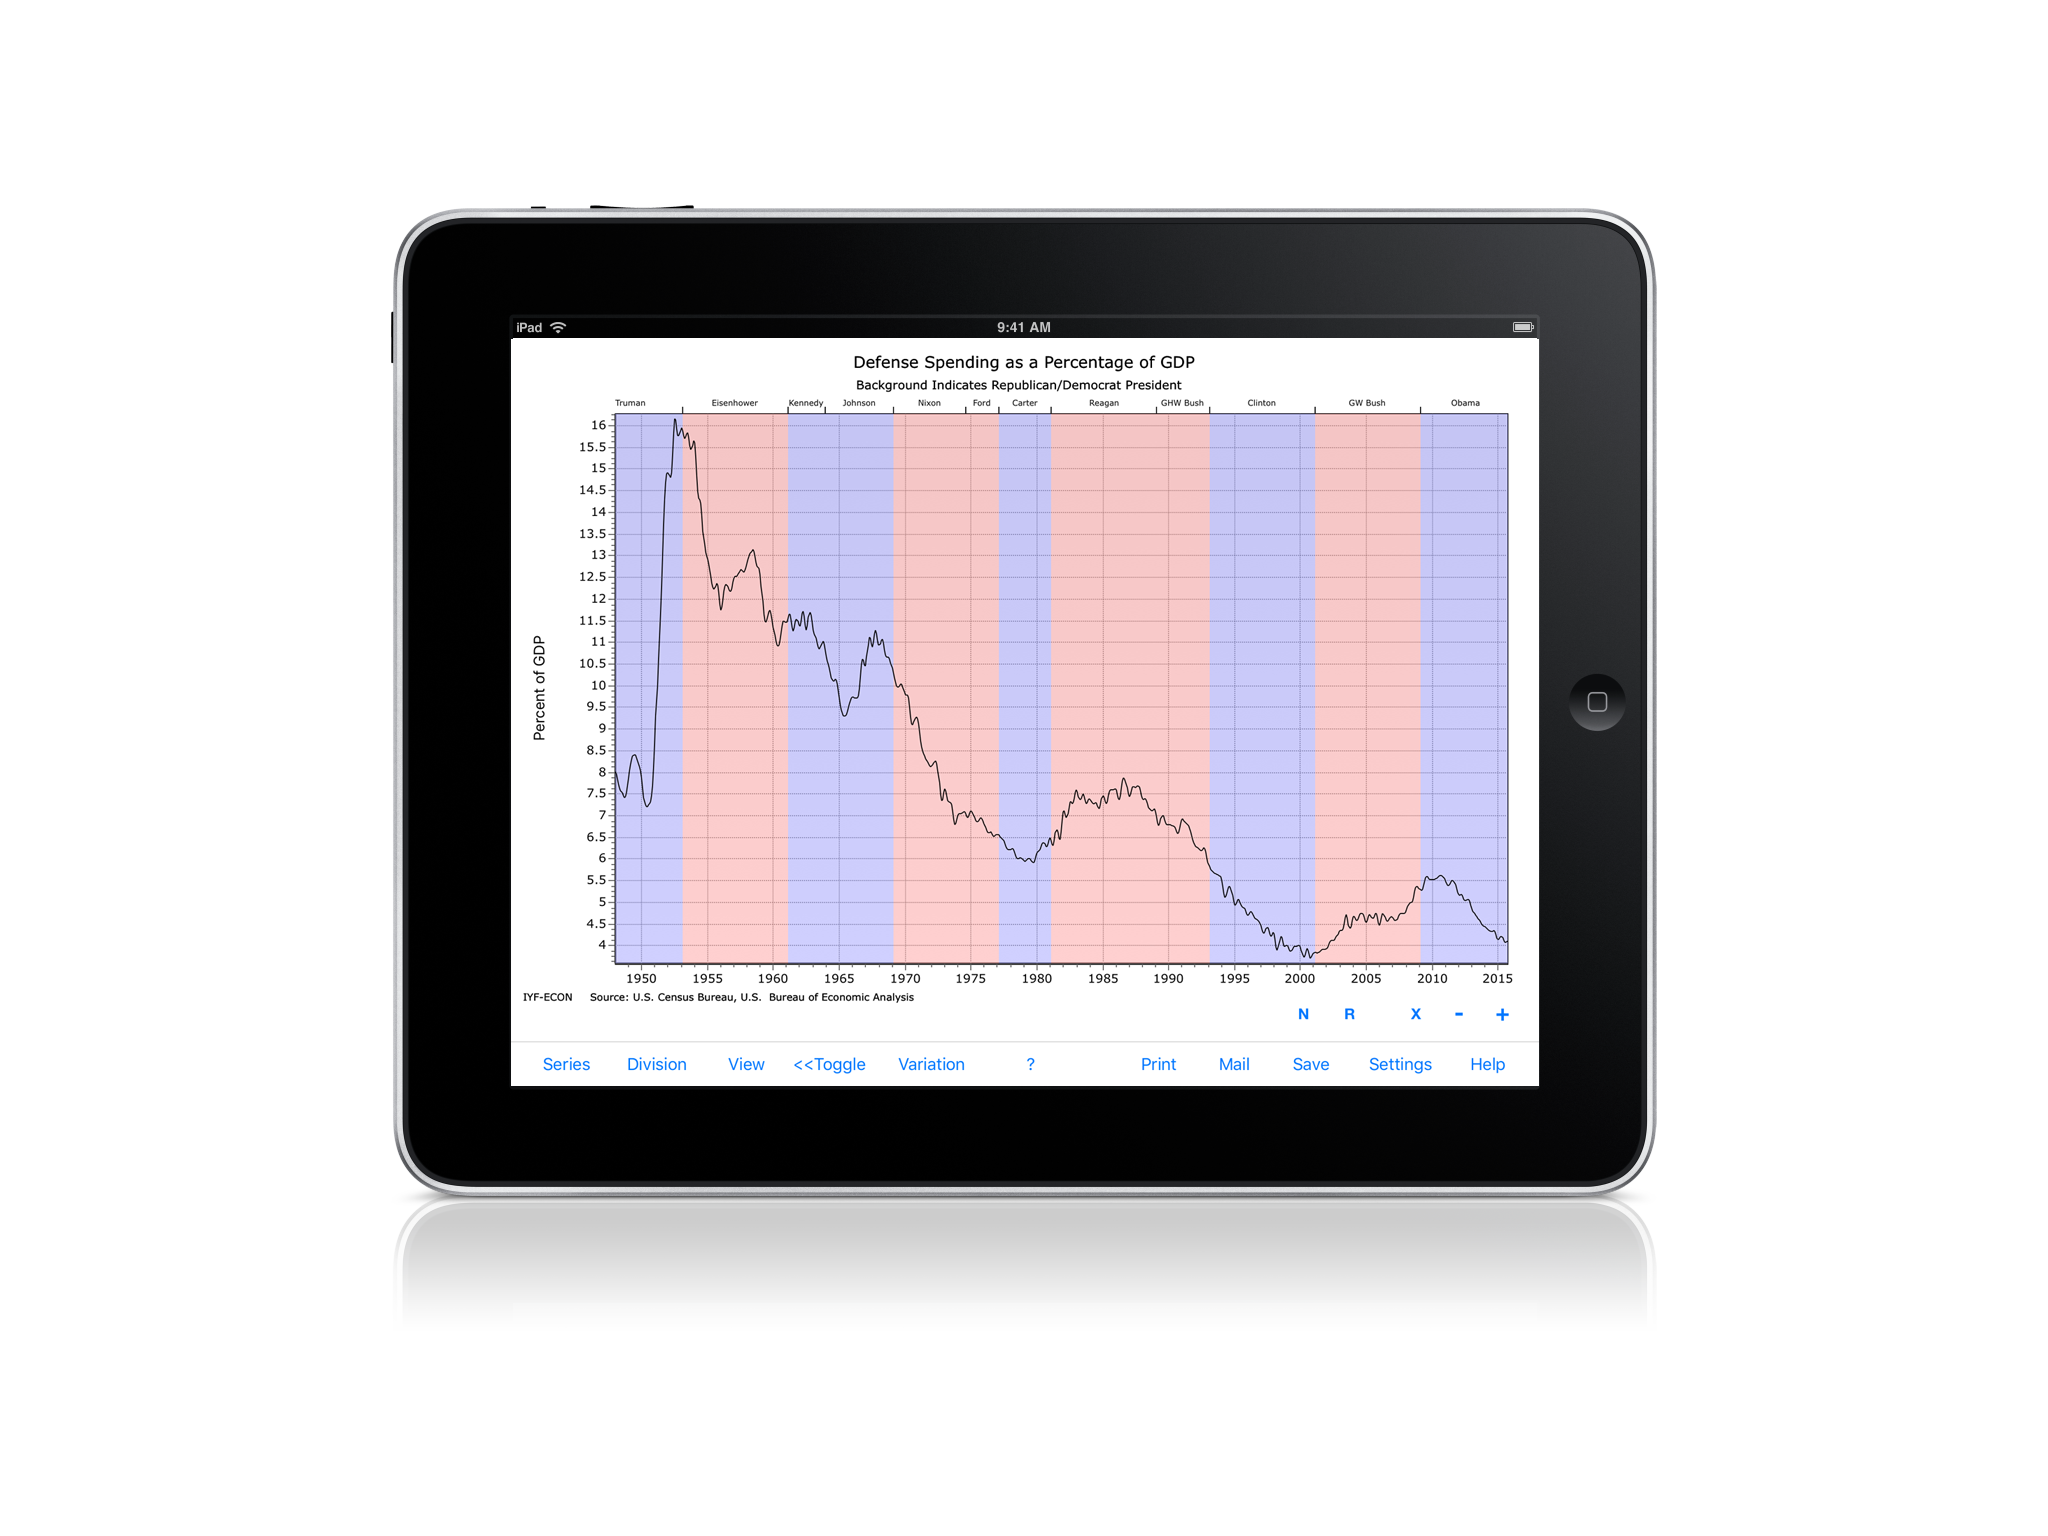
The republicans increase defense spending and drive down the average income. The democrats send federal spending through the roof. It’s an election year, and these opinions are impossible to avoid. Turn on your television, connect to the Internet, or have a discussion with your friends and you’re bound to be bombarded by facts, statistics, patterns, and trends that all seem to have one simple underlying message: I’m right and you’re not. But statistics never lie, right? People never skew the data or the truth to support their opinions, do they? The result is the passionate, unrelenting stalemate that comes from both sides being completely self-assured.
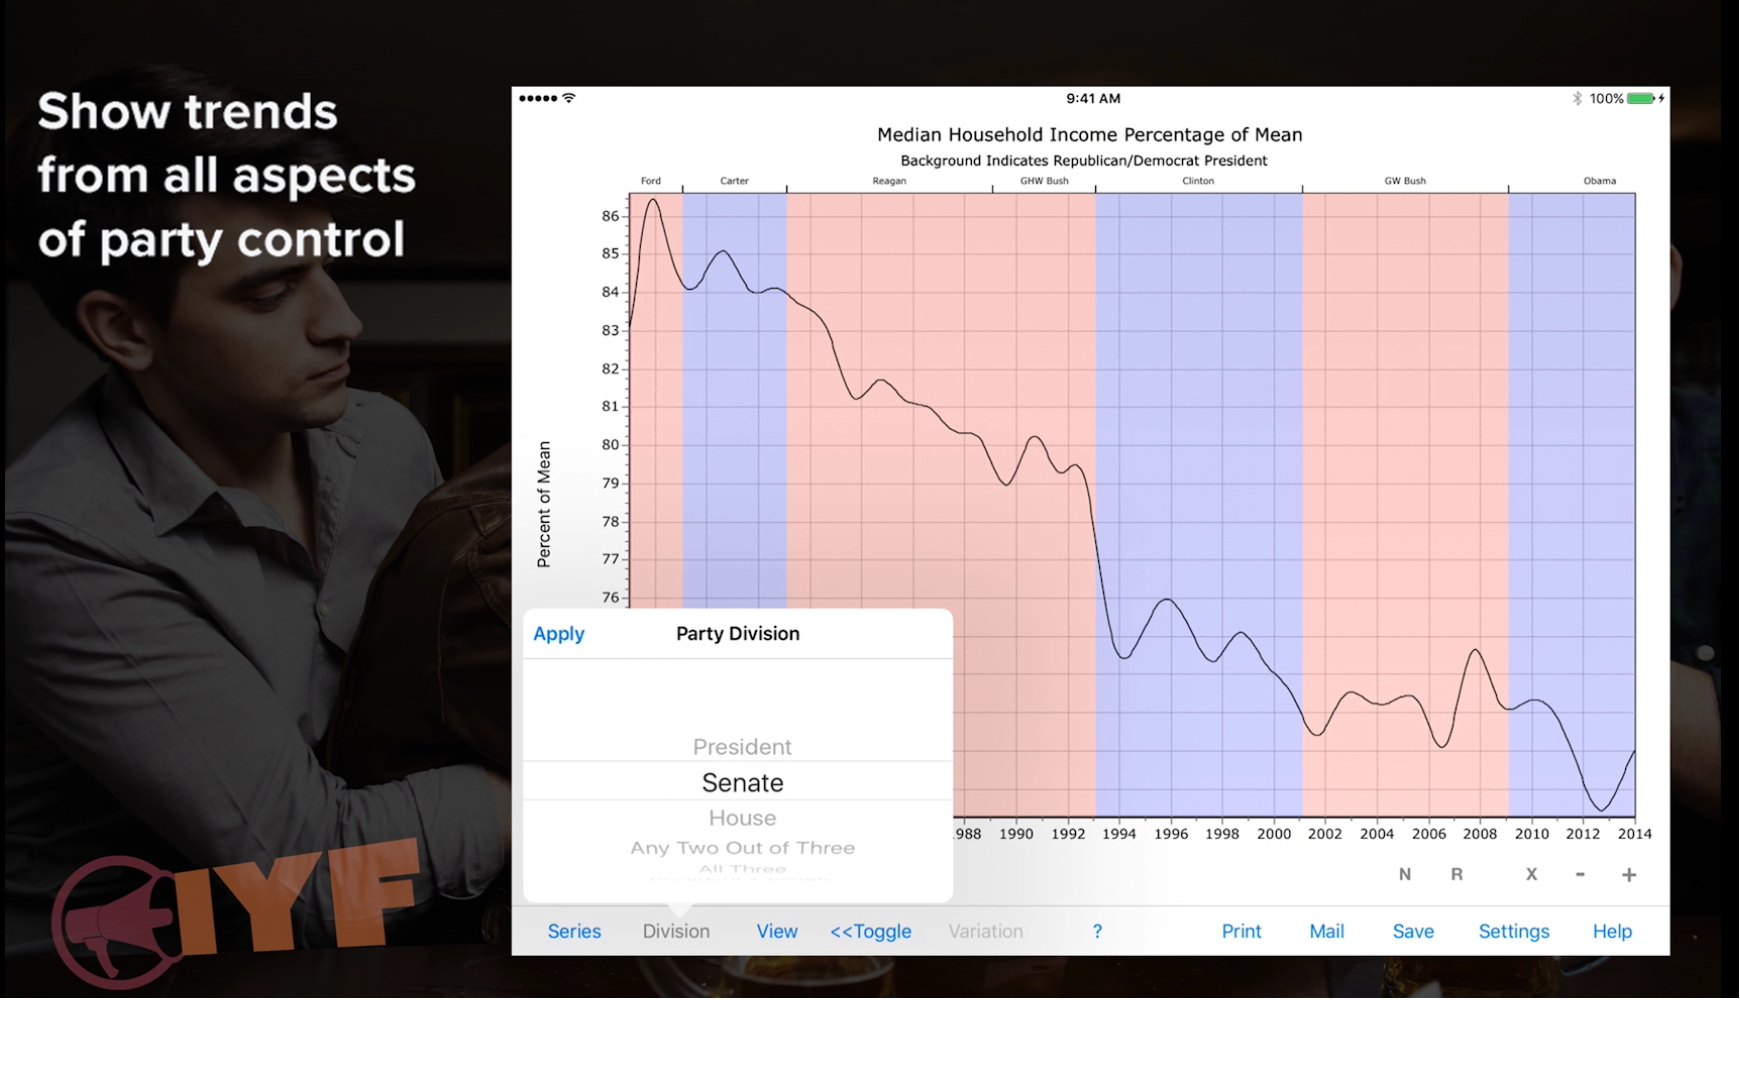
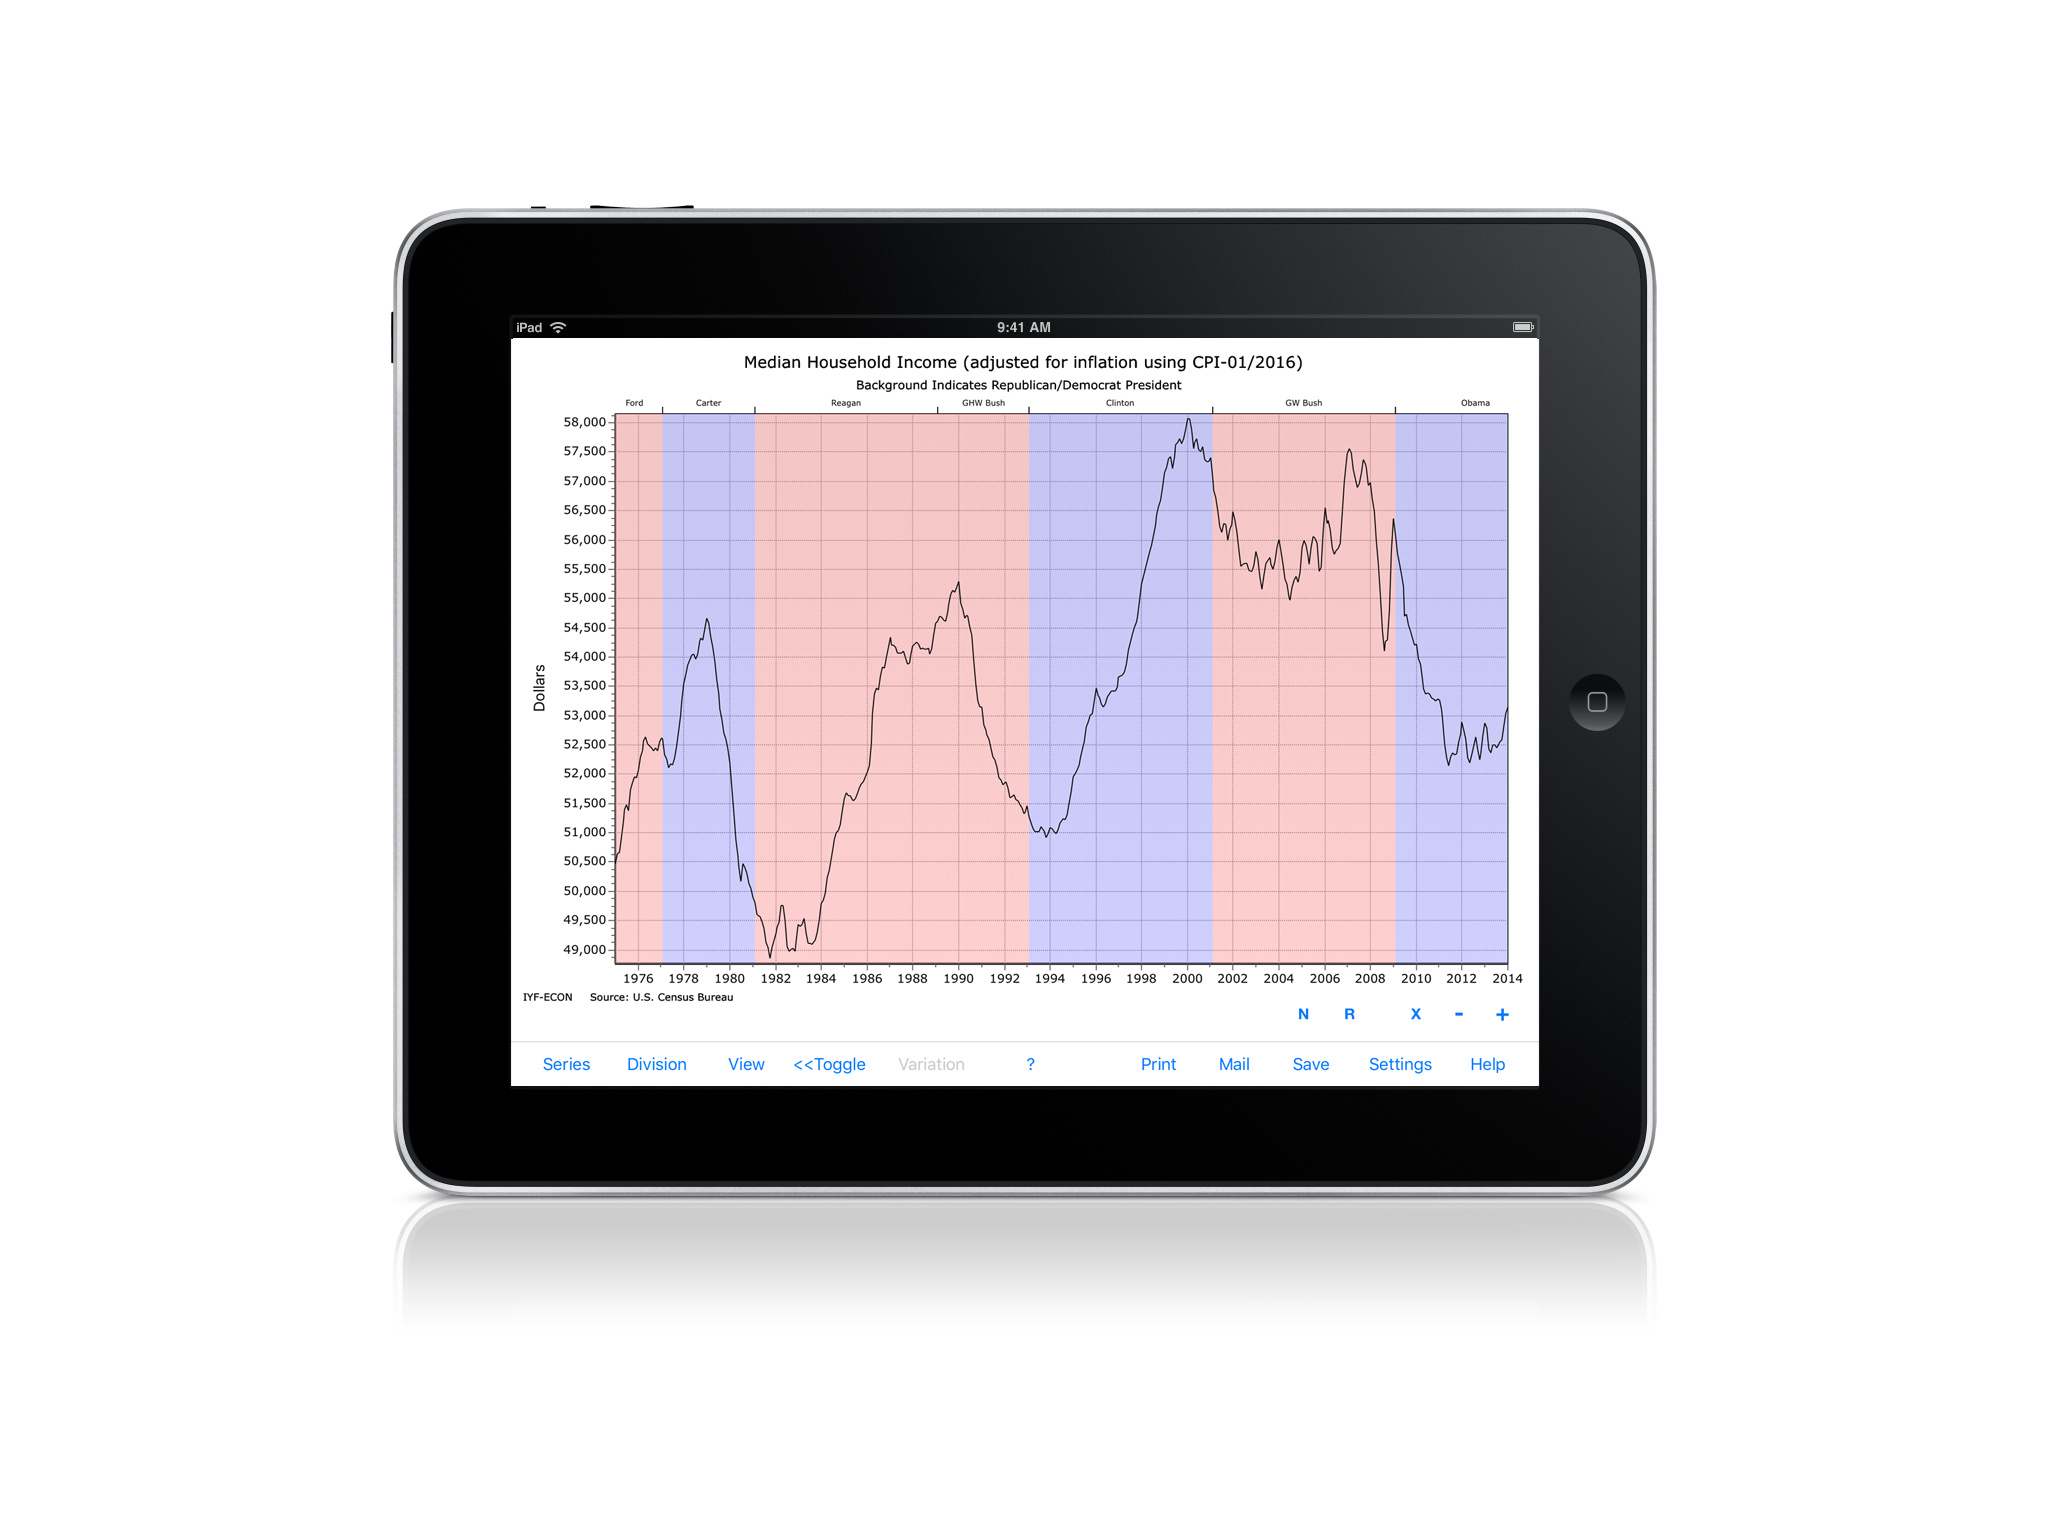
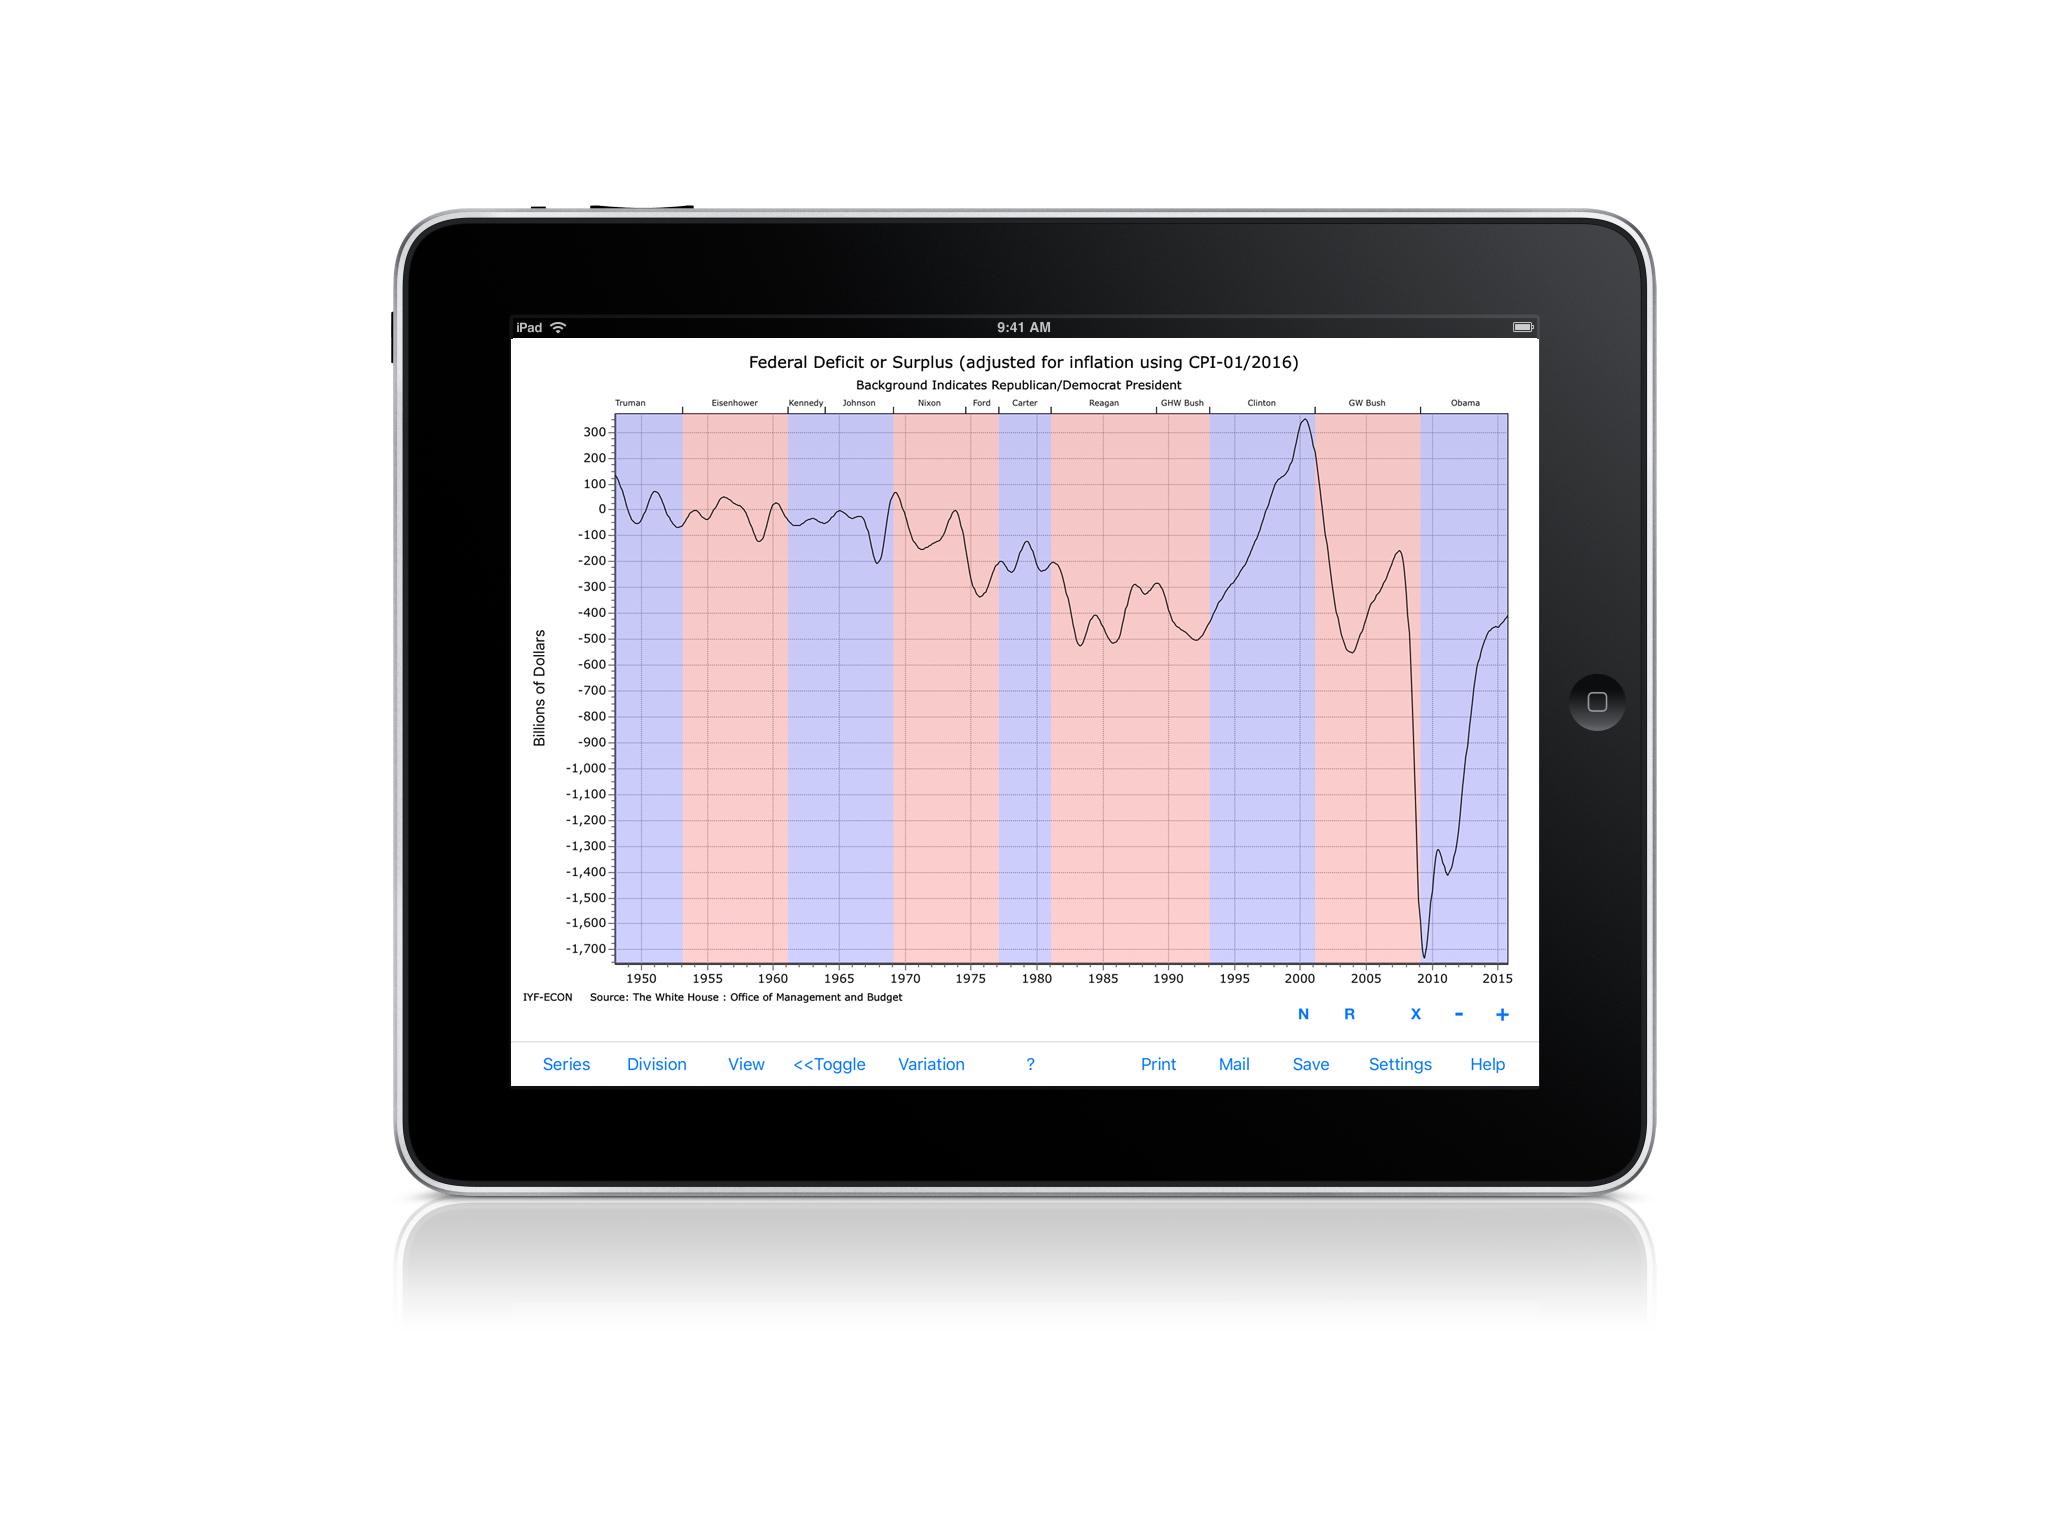
IYF gives you the power to put the self-assured in their place. The app shows a huge array of data, from defense spending to median household income, on an historical timeframe. It can also be overlaid to show trends and performance under specific party administrations. Need to show your friend that the deficit decreased more rapidly under Democratic presidents than Republicans? Pull up the graph and put it in his face. Need to stop the Facebook debate over what has happened to the average household income since the Reagan administration? Post the graphic with the hashtag #InYourFace.
Settle social media discussions, barroom debates, and friendly discussions with the simple, intuitive app that puts a little FYI In Your Face.

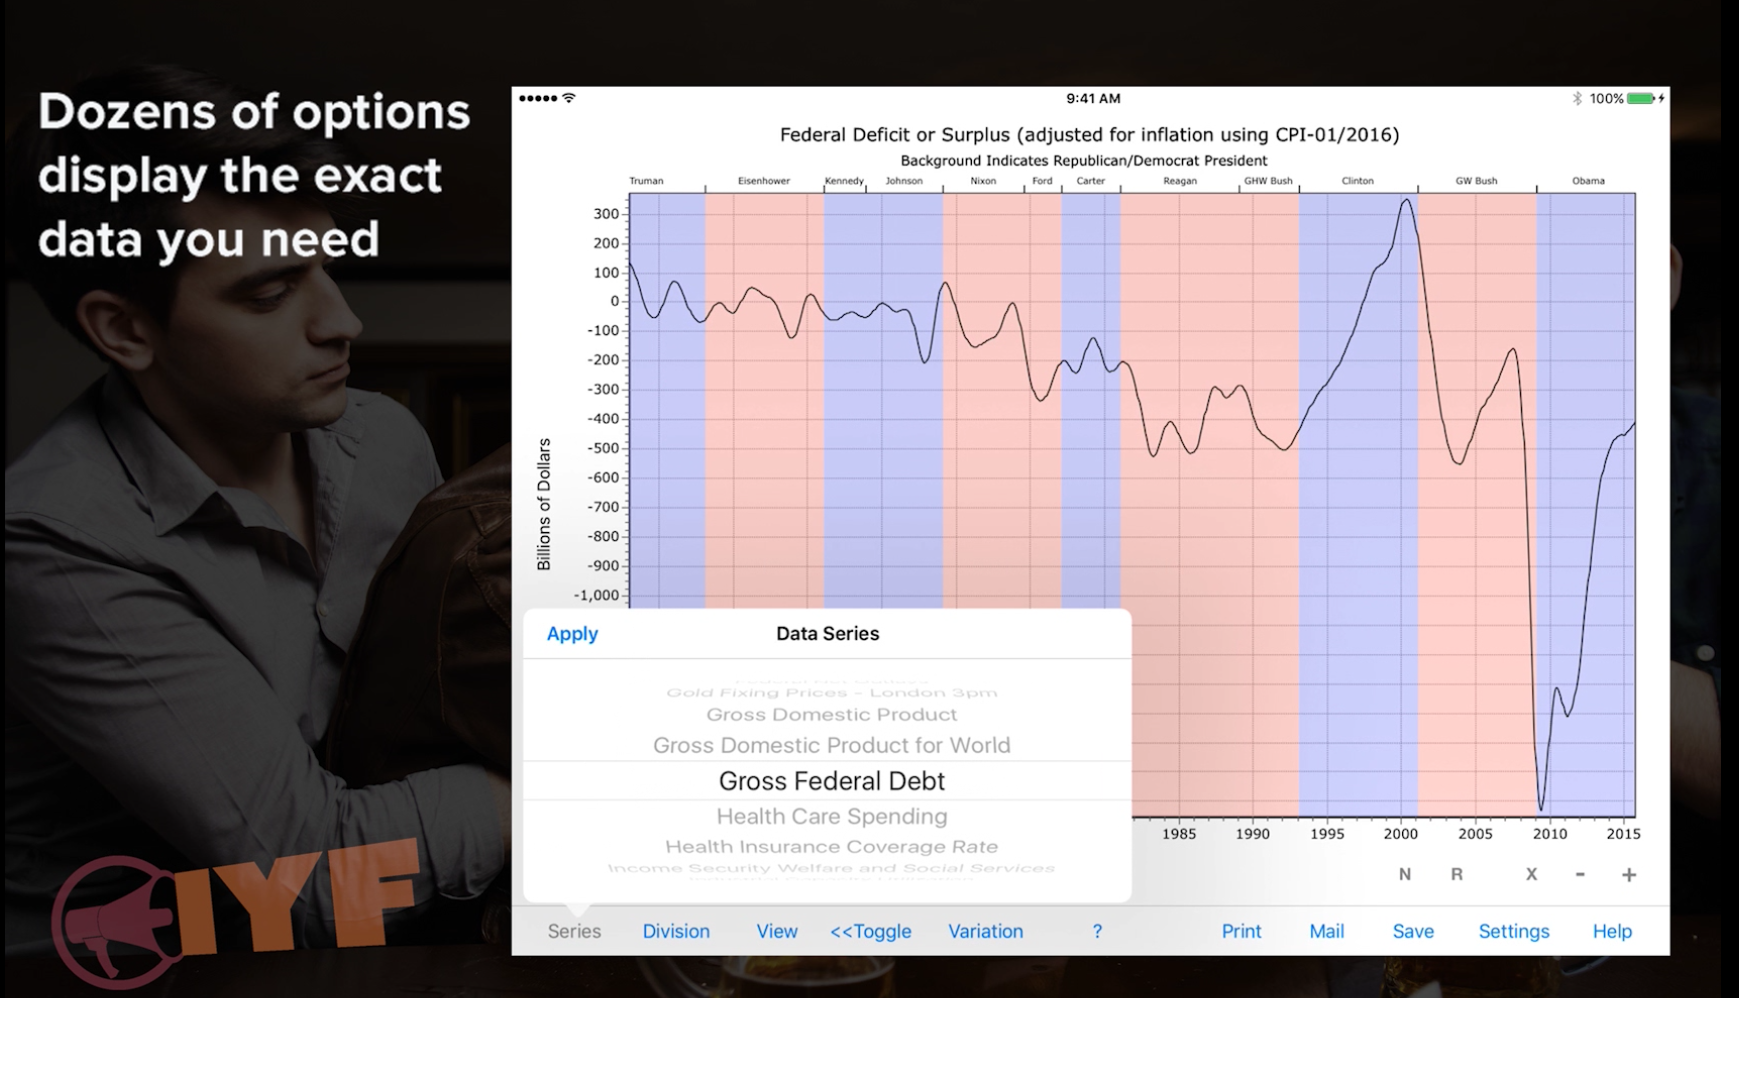
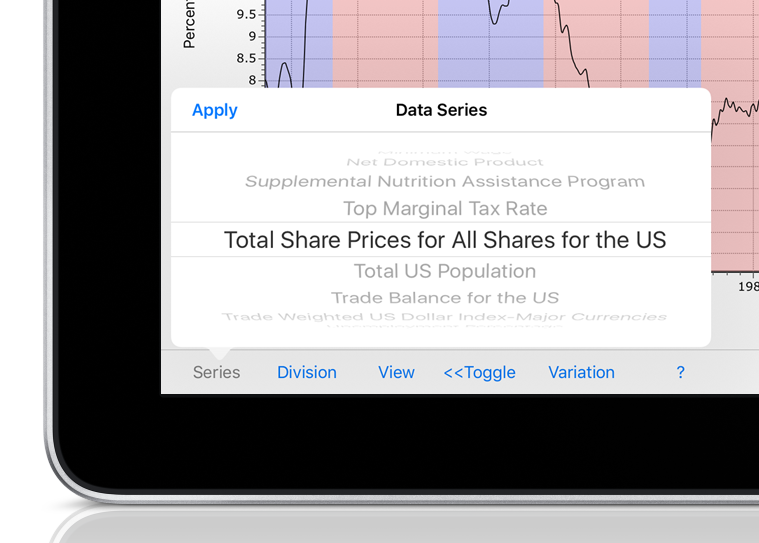
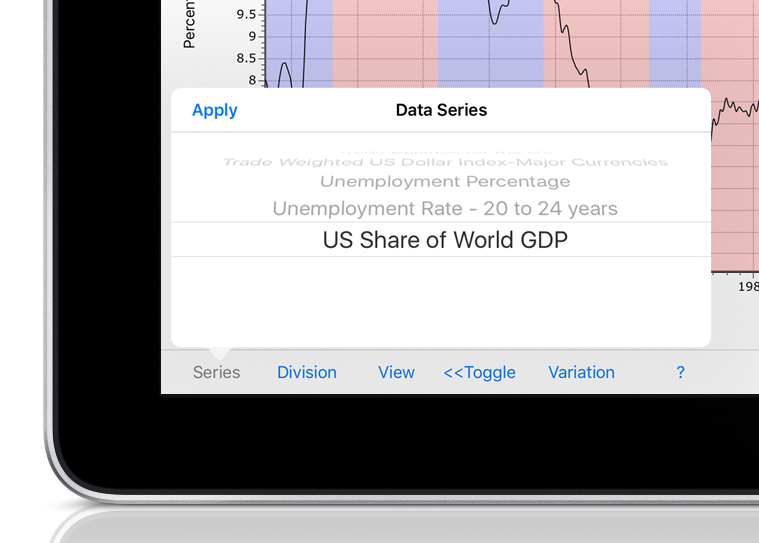
This app settles debates. You choose the data – choose to show any historical data — such as federal defense spending — by president, house, senate, or any subset to get the real skinny on which party walks the walk when it comes to their campaign promises.


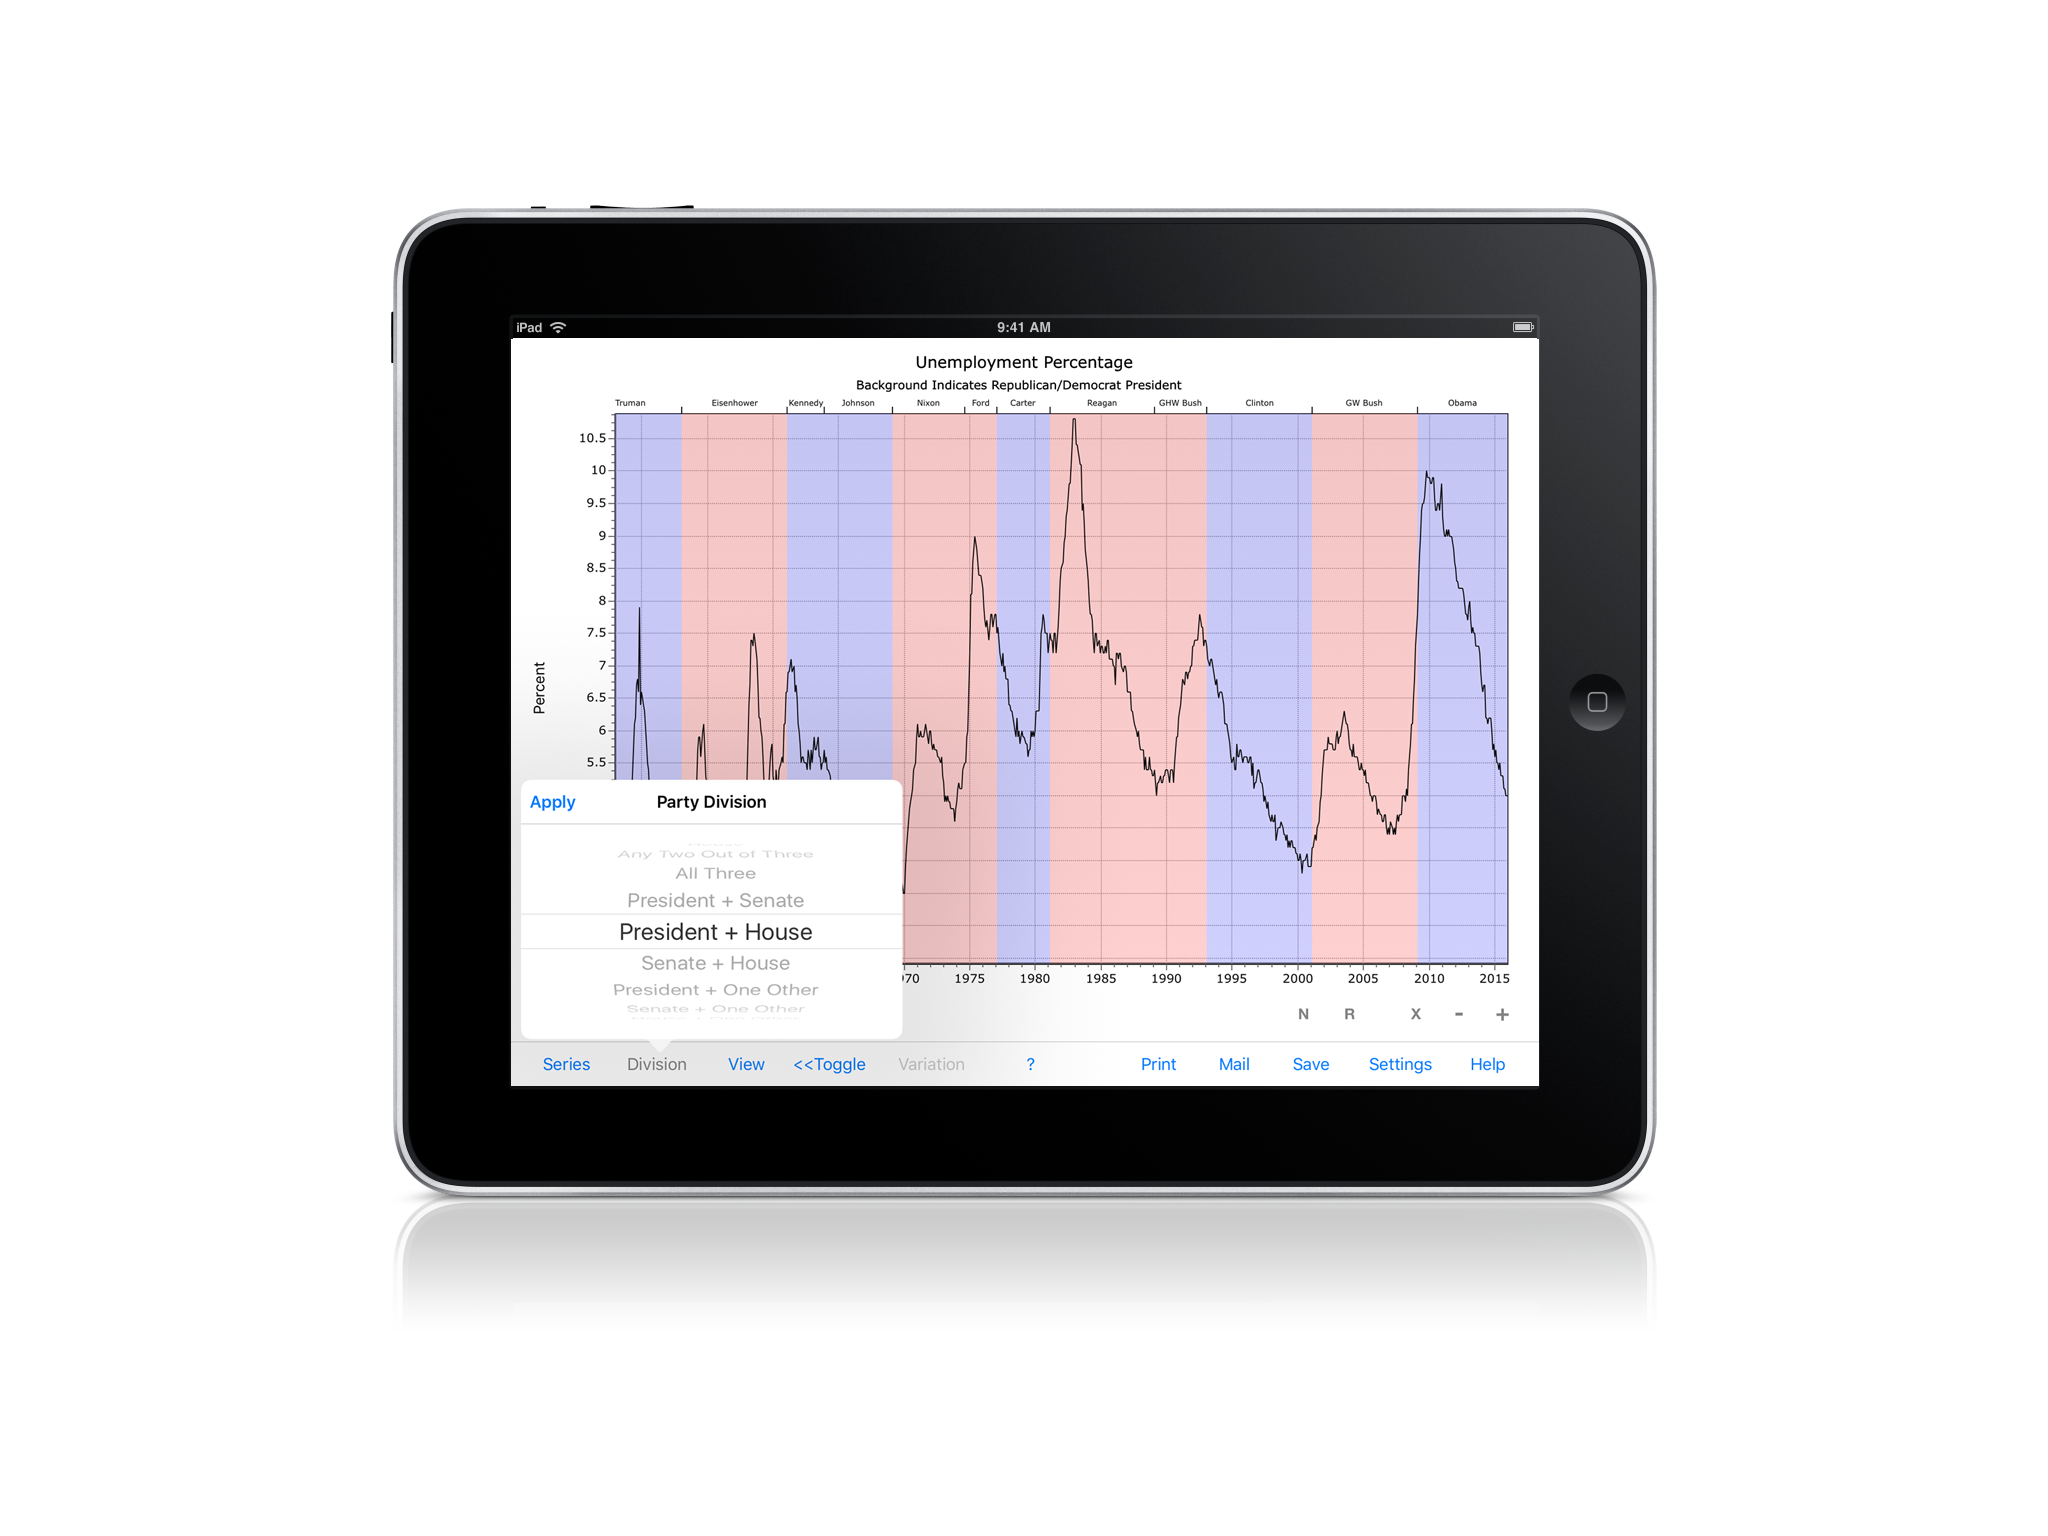
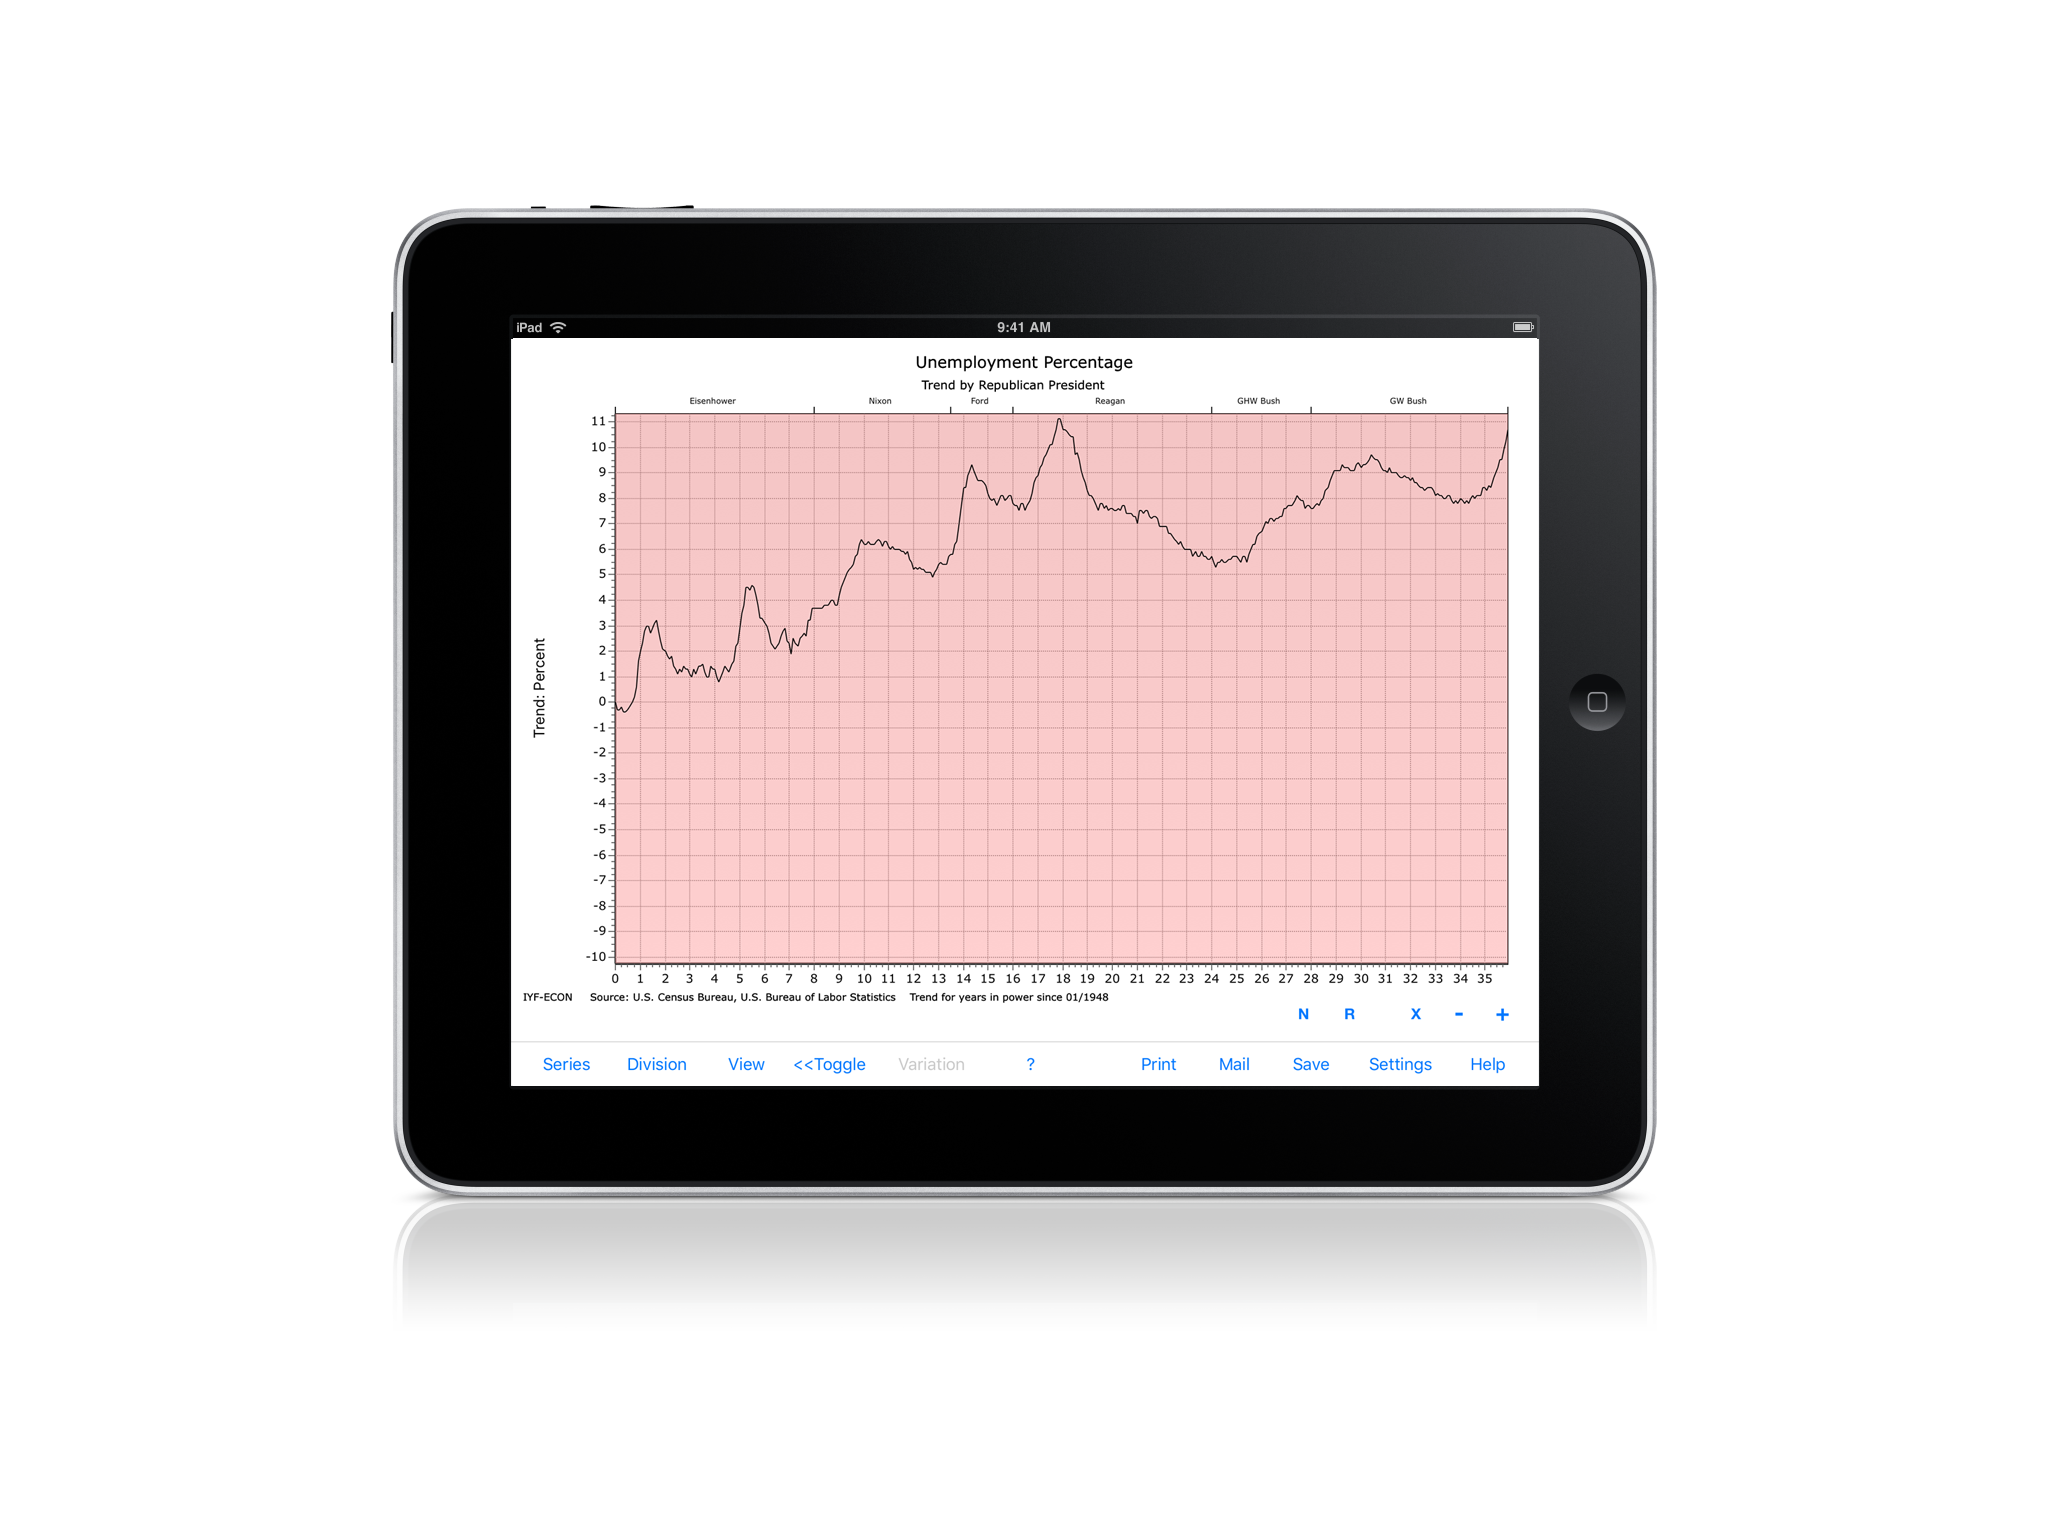
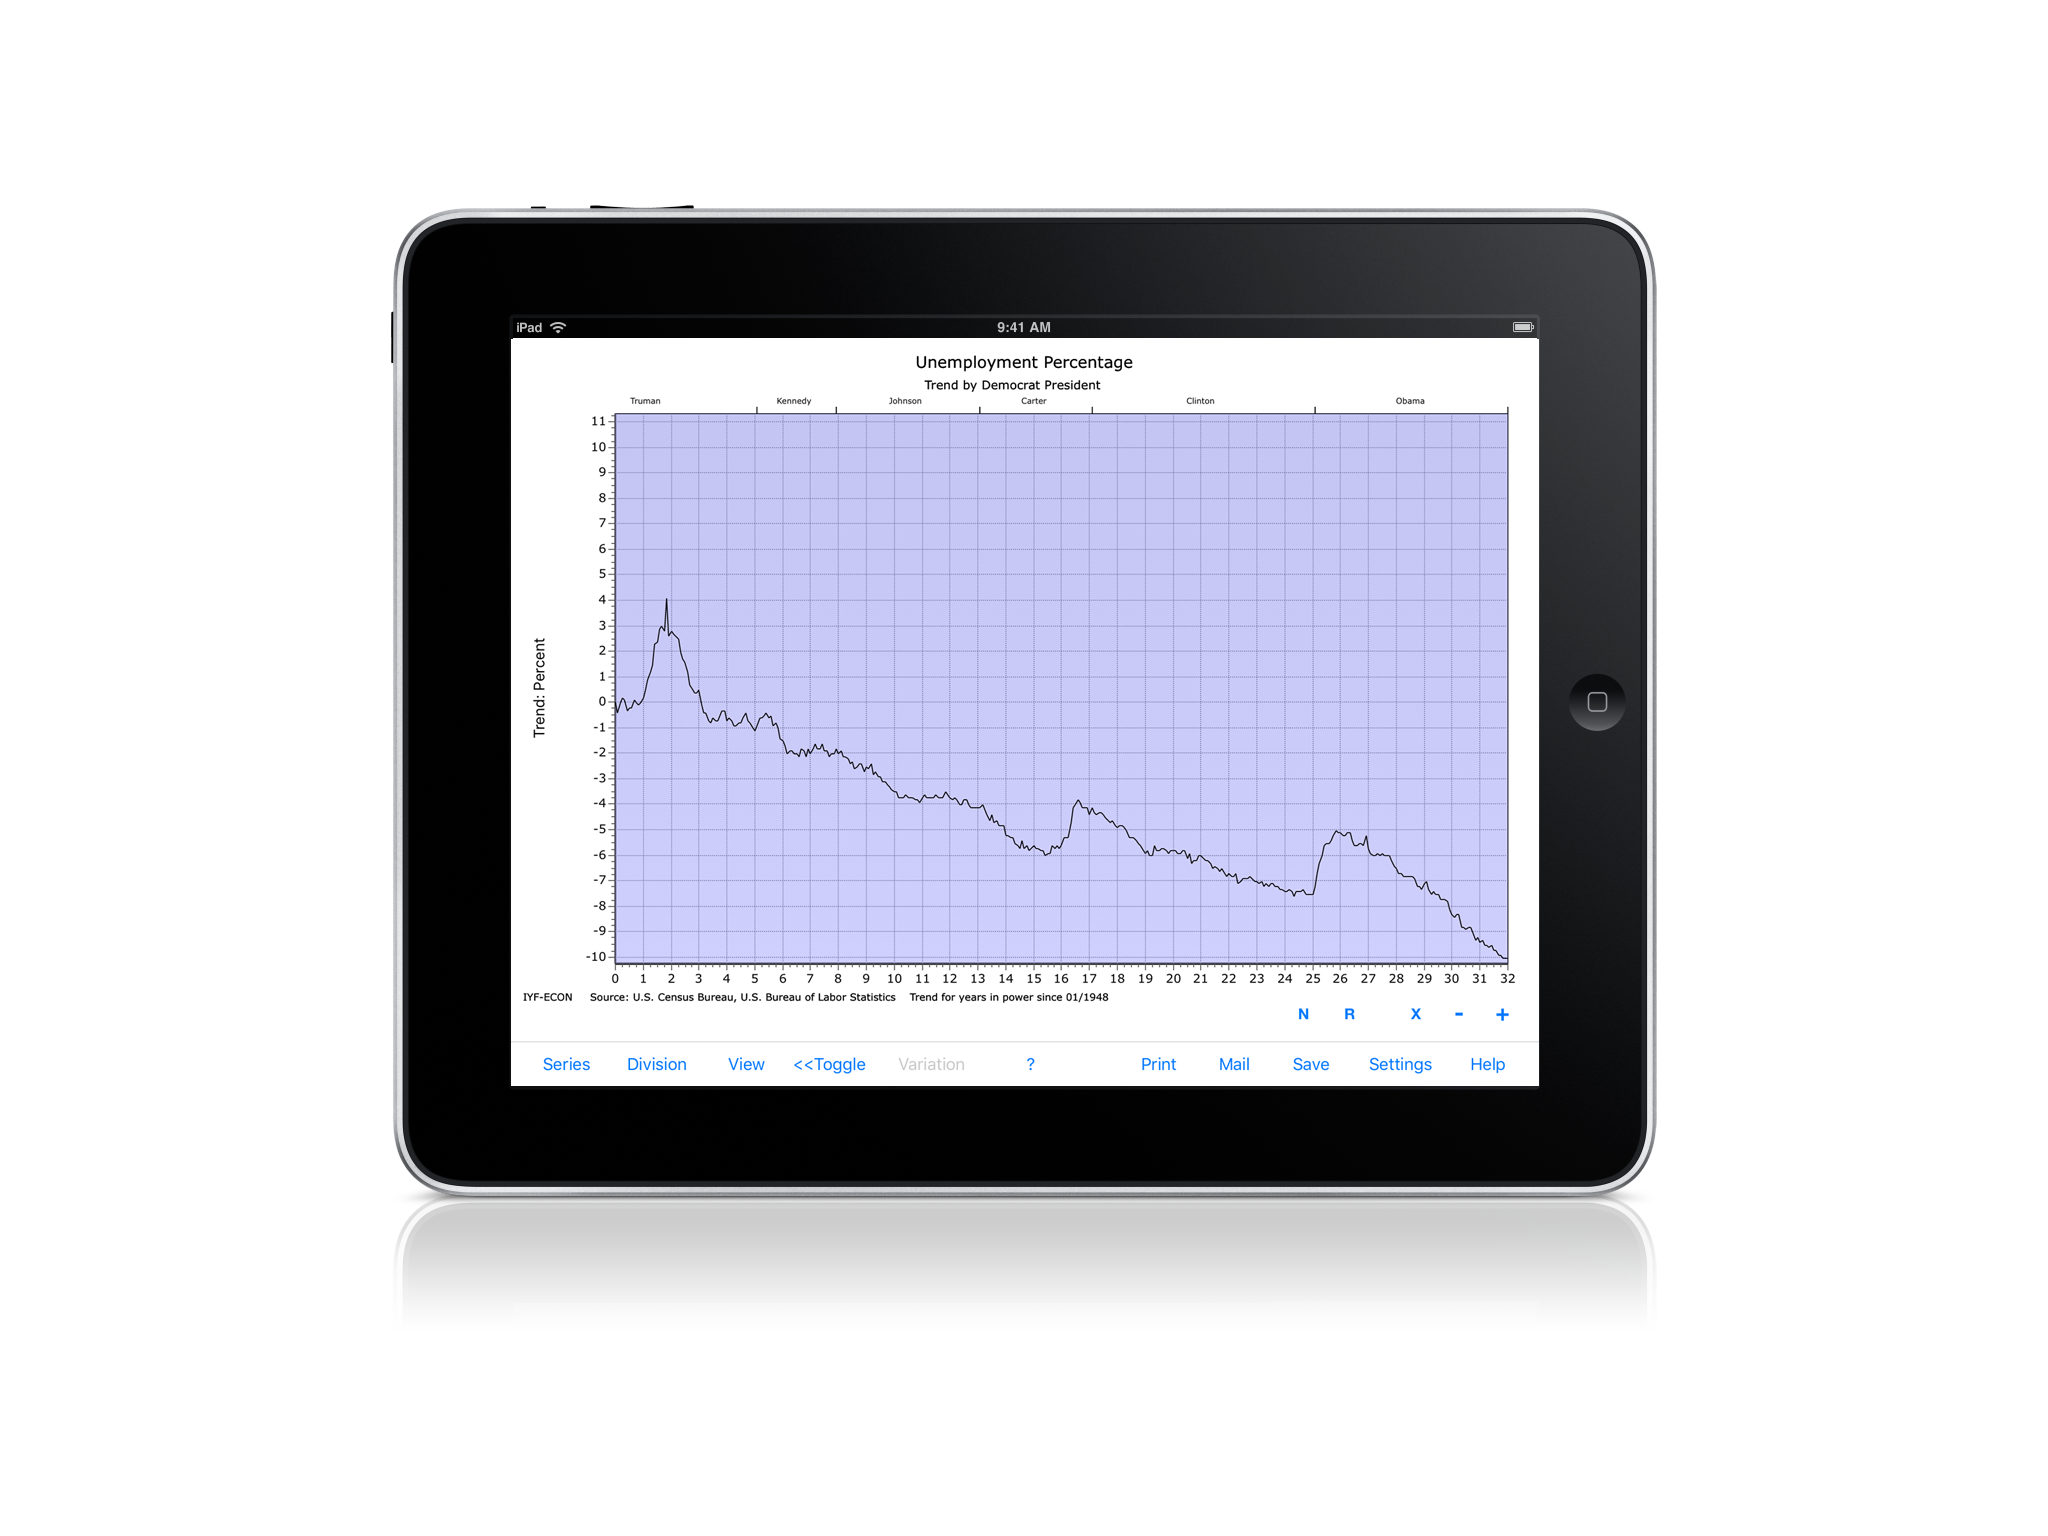
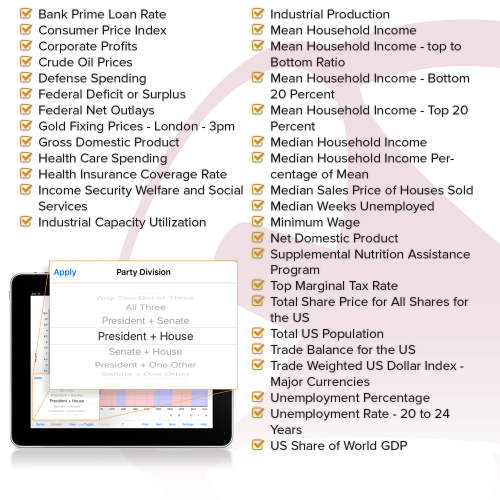
IYF offers hundreds of customizable data displays. Choose your data series, whether you want to see the data by presidency, house, senate, etc., and then choose whether to view the party information contiguously or separately.
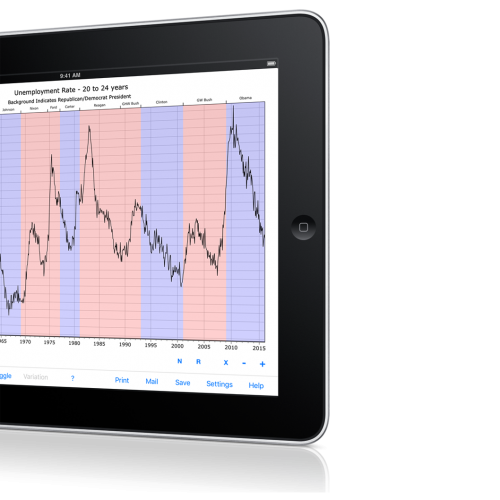
See IYF in action

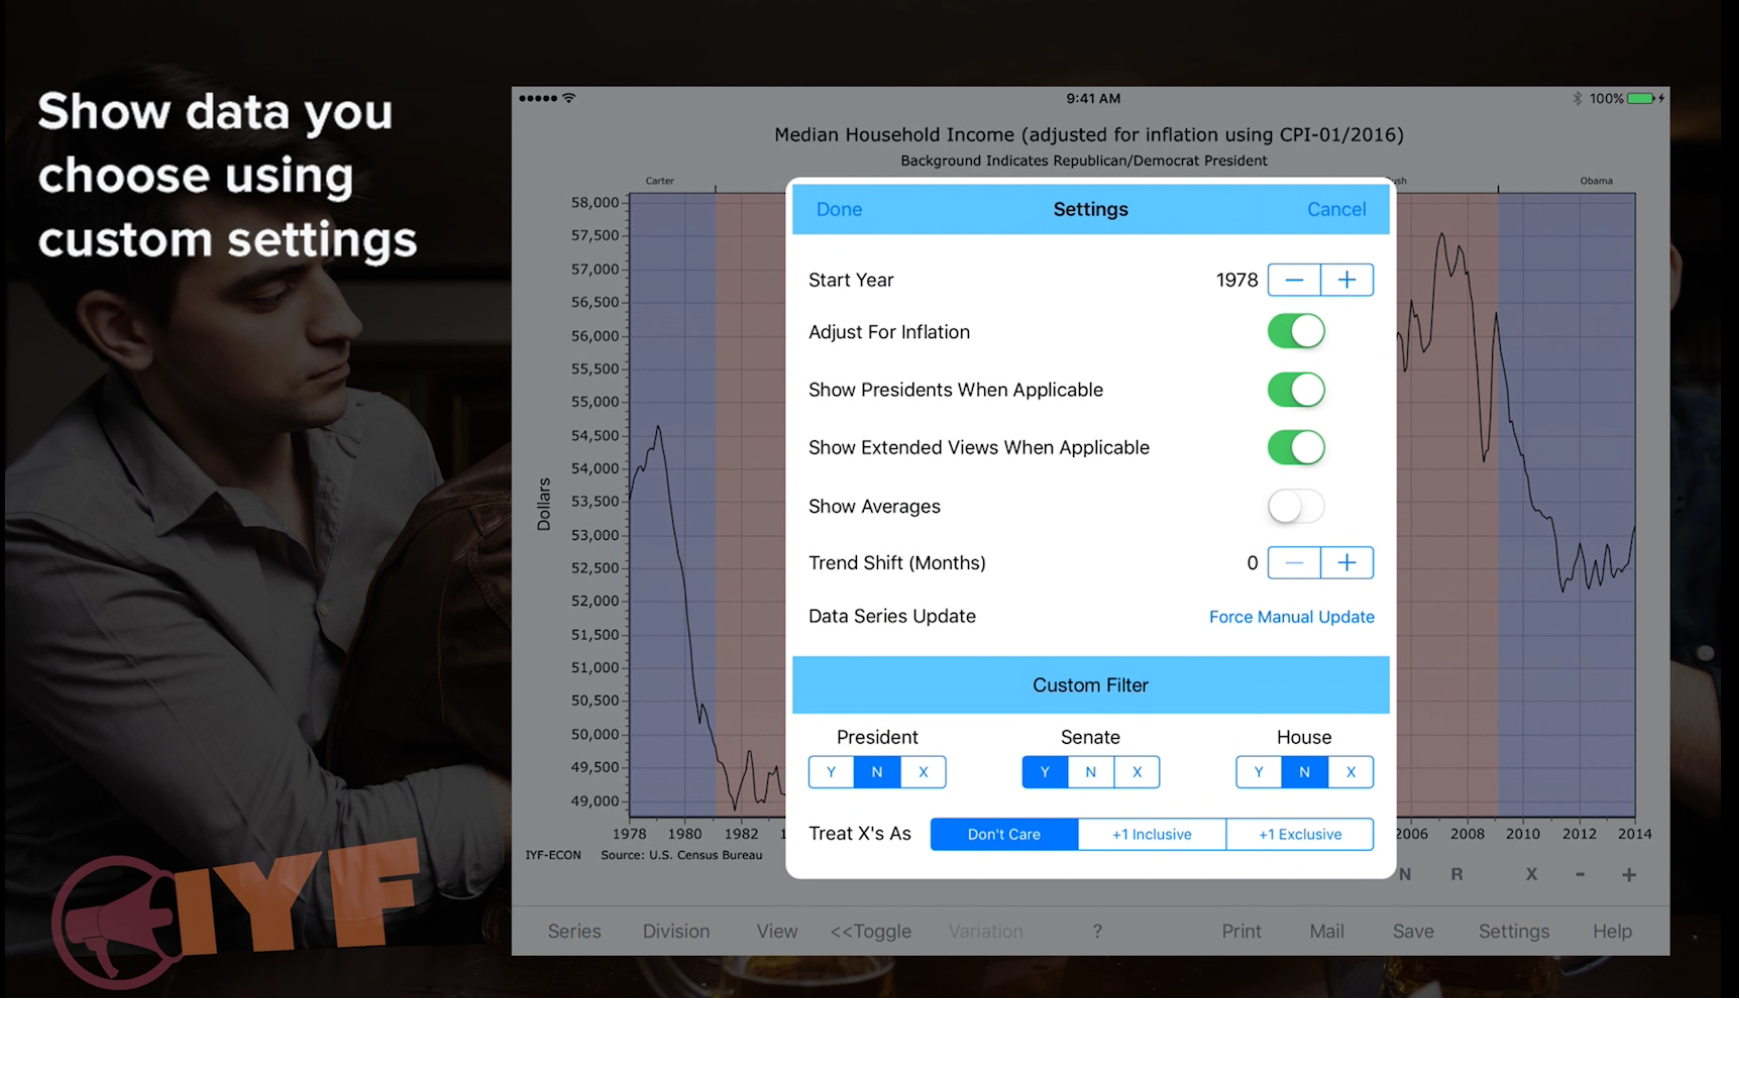
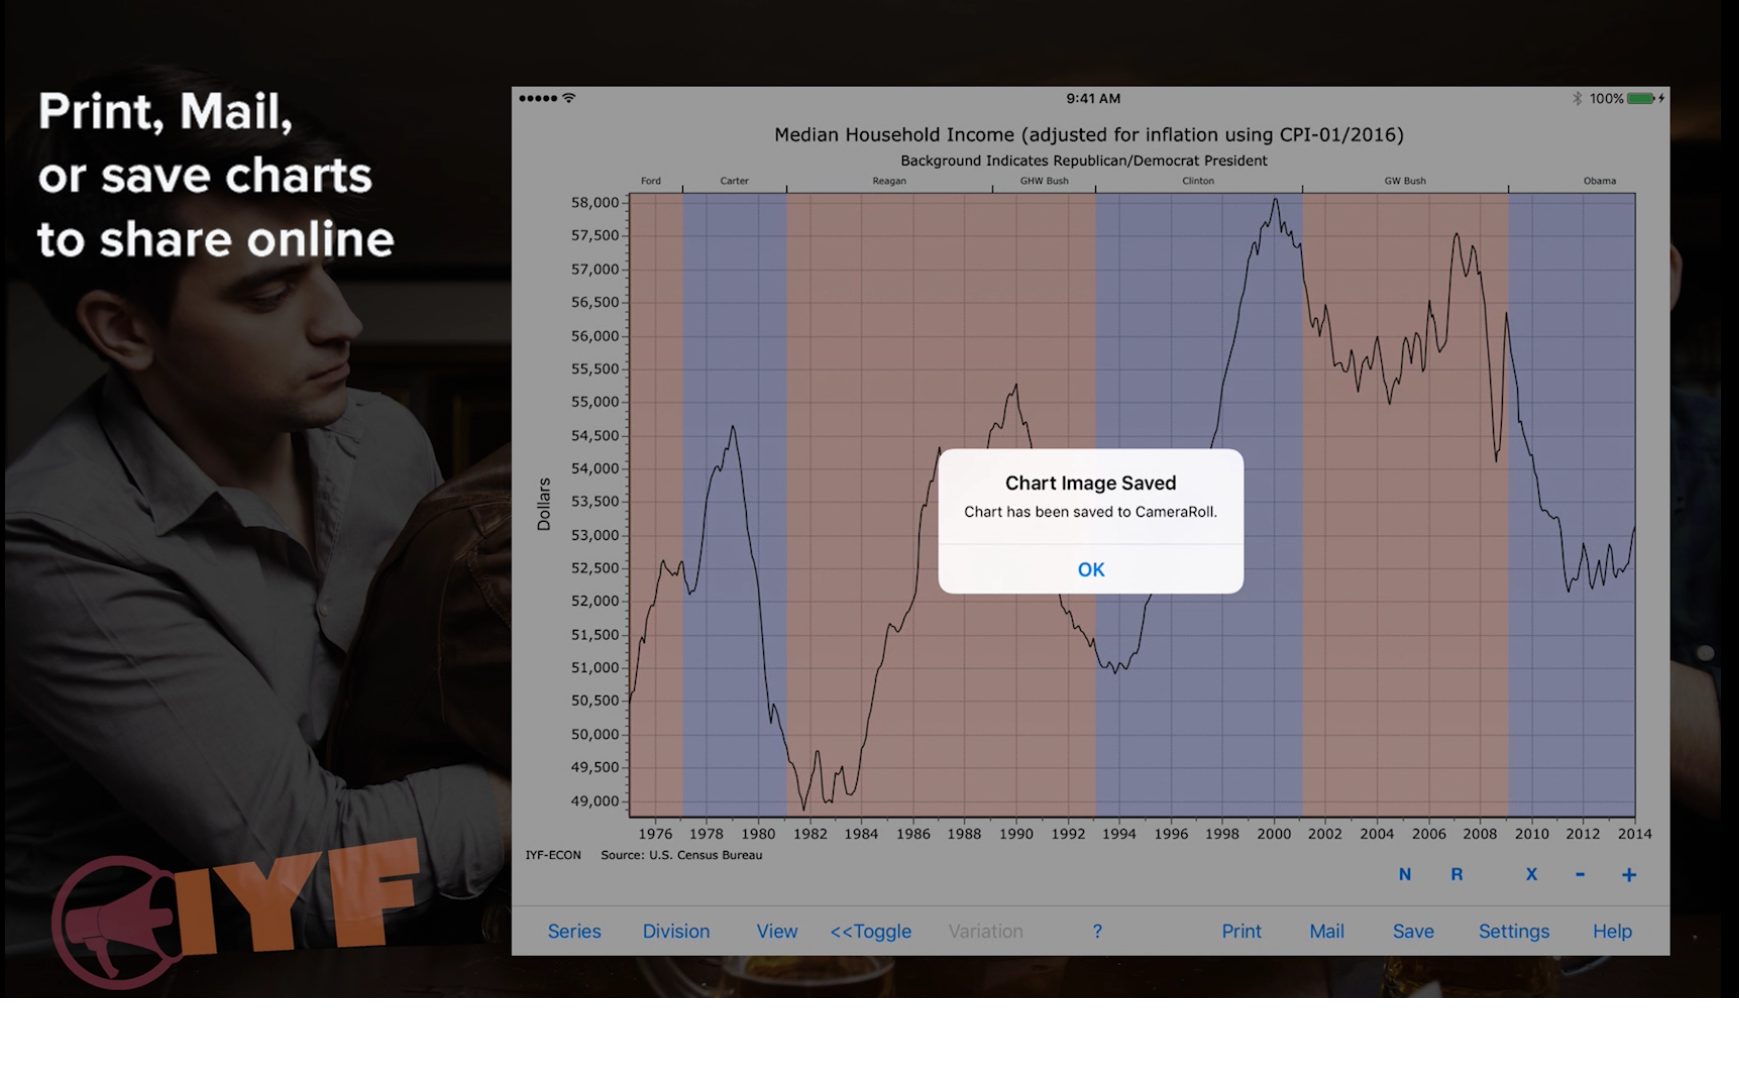
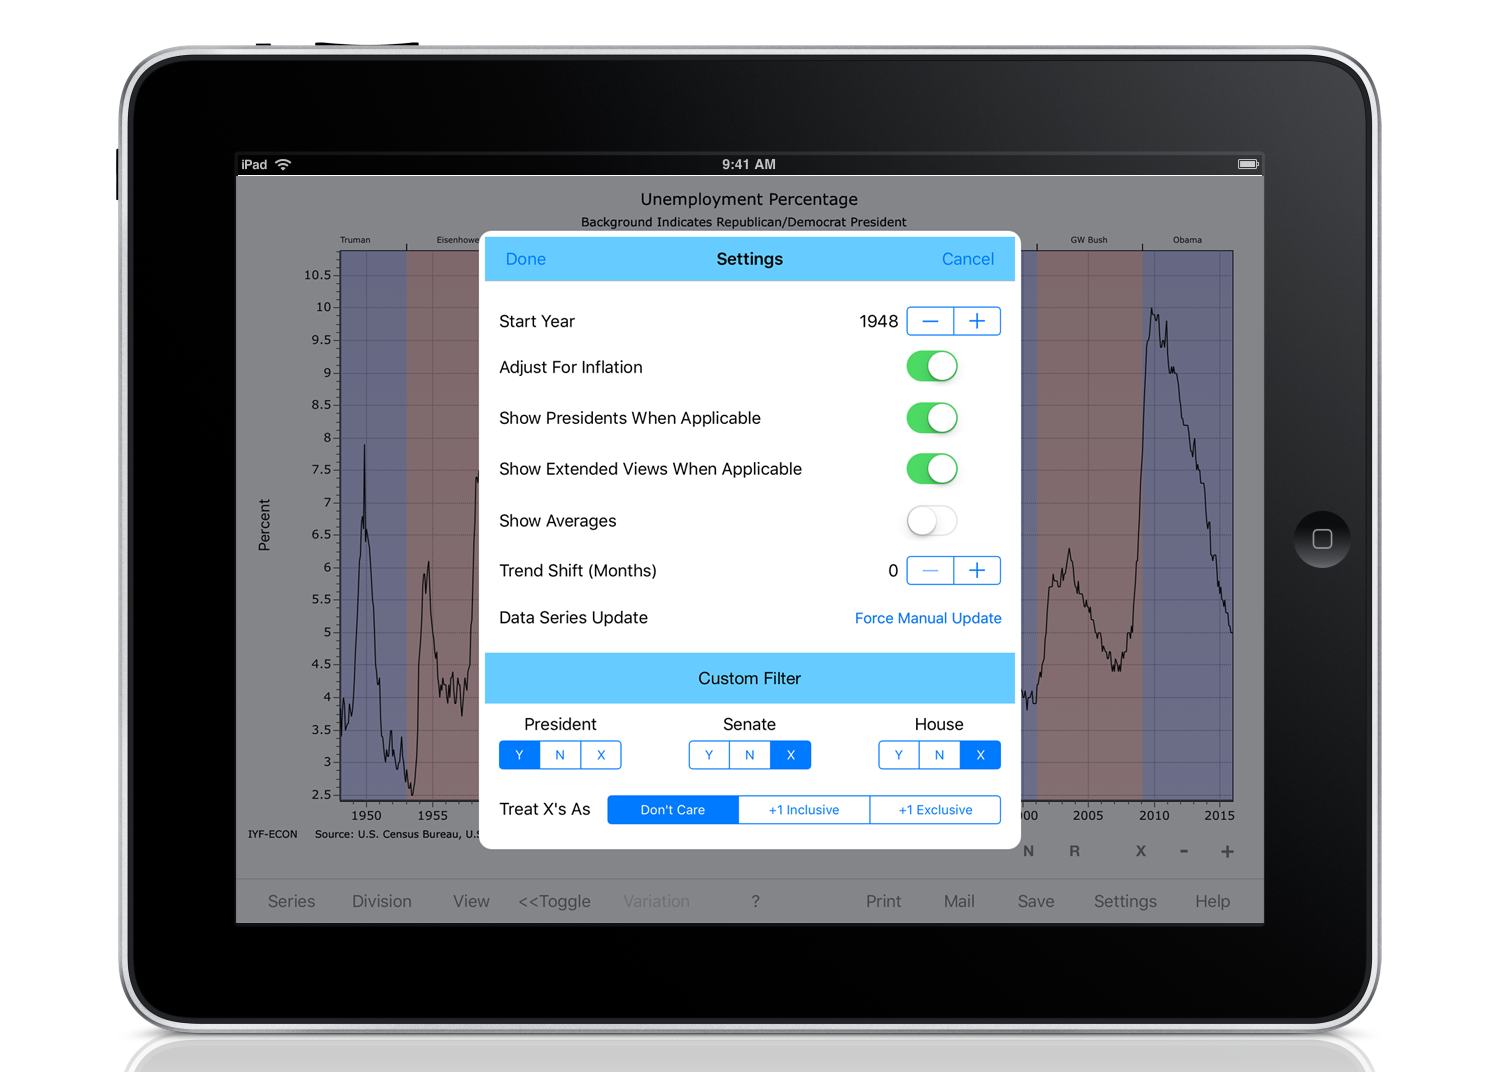
See the data you want. The information displays can be customized to show specific date ranges, parties, inflation adjustment, and many more. The data can be saved, printed, or emailed to use in reports, social media, or just for display on your device.


Now available for iPhone and iPad
![]()
 |
|